Dashboard: Plutono
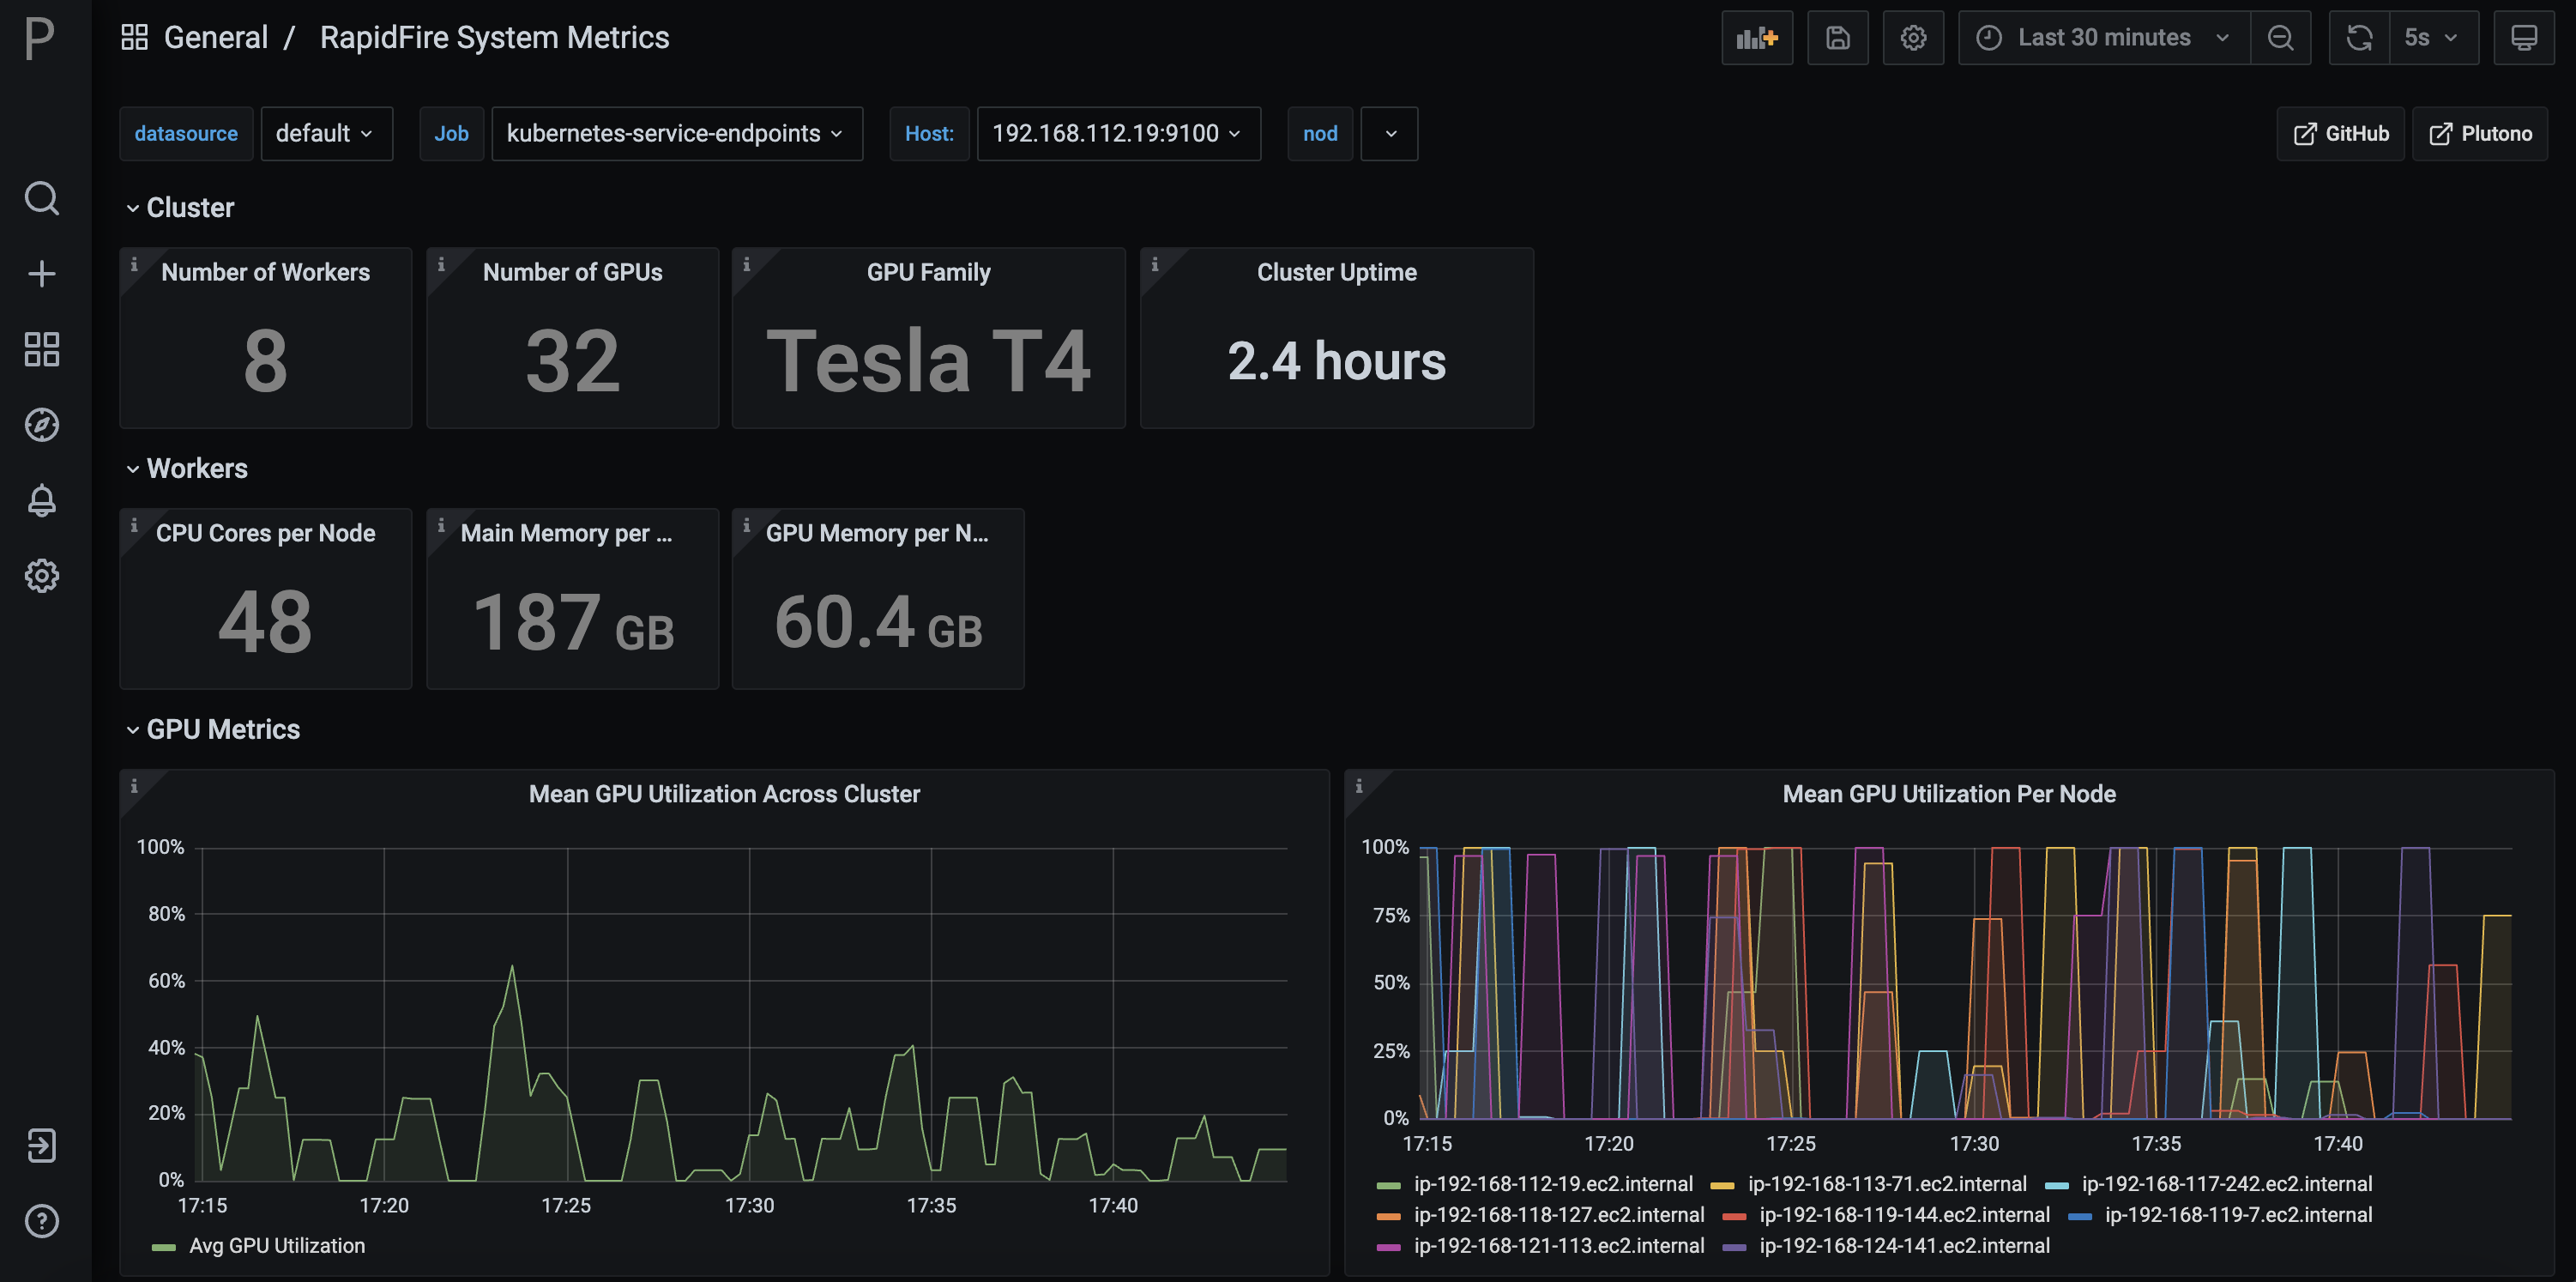
This is a standard system metrics dashboard based on the OSS tool Plutono that is a fork of Grafana.
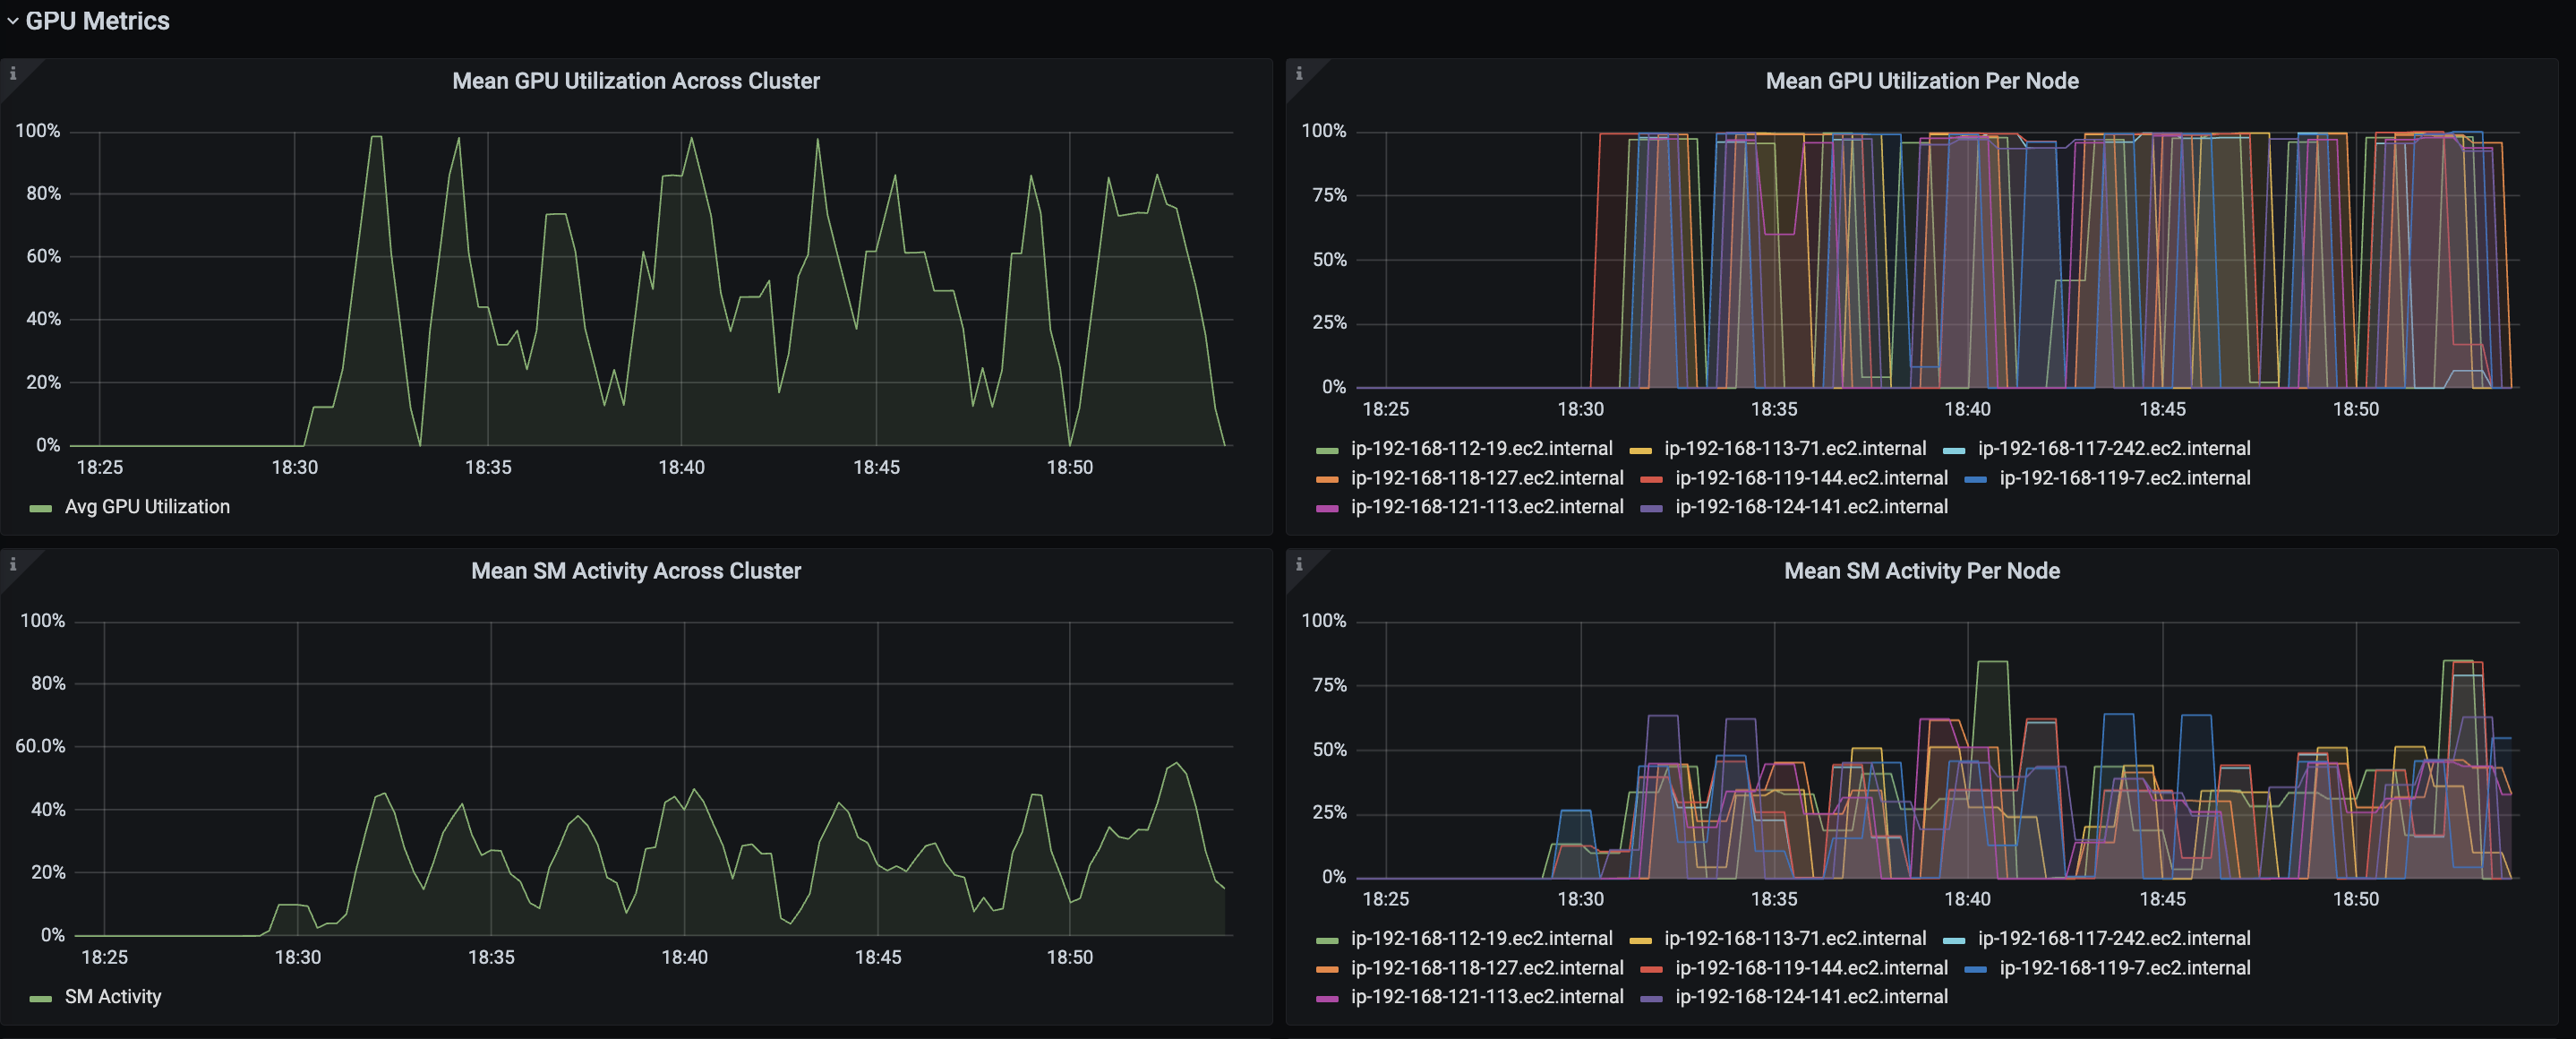
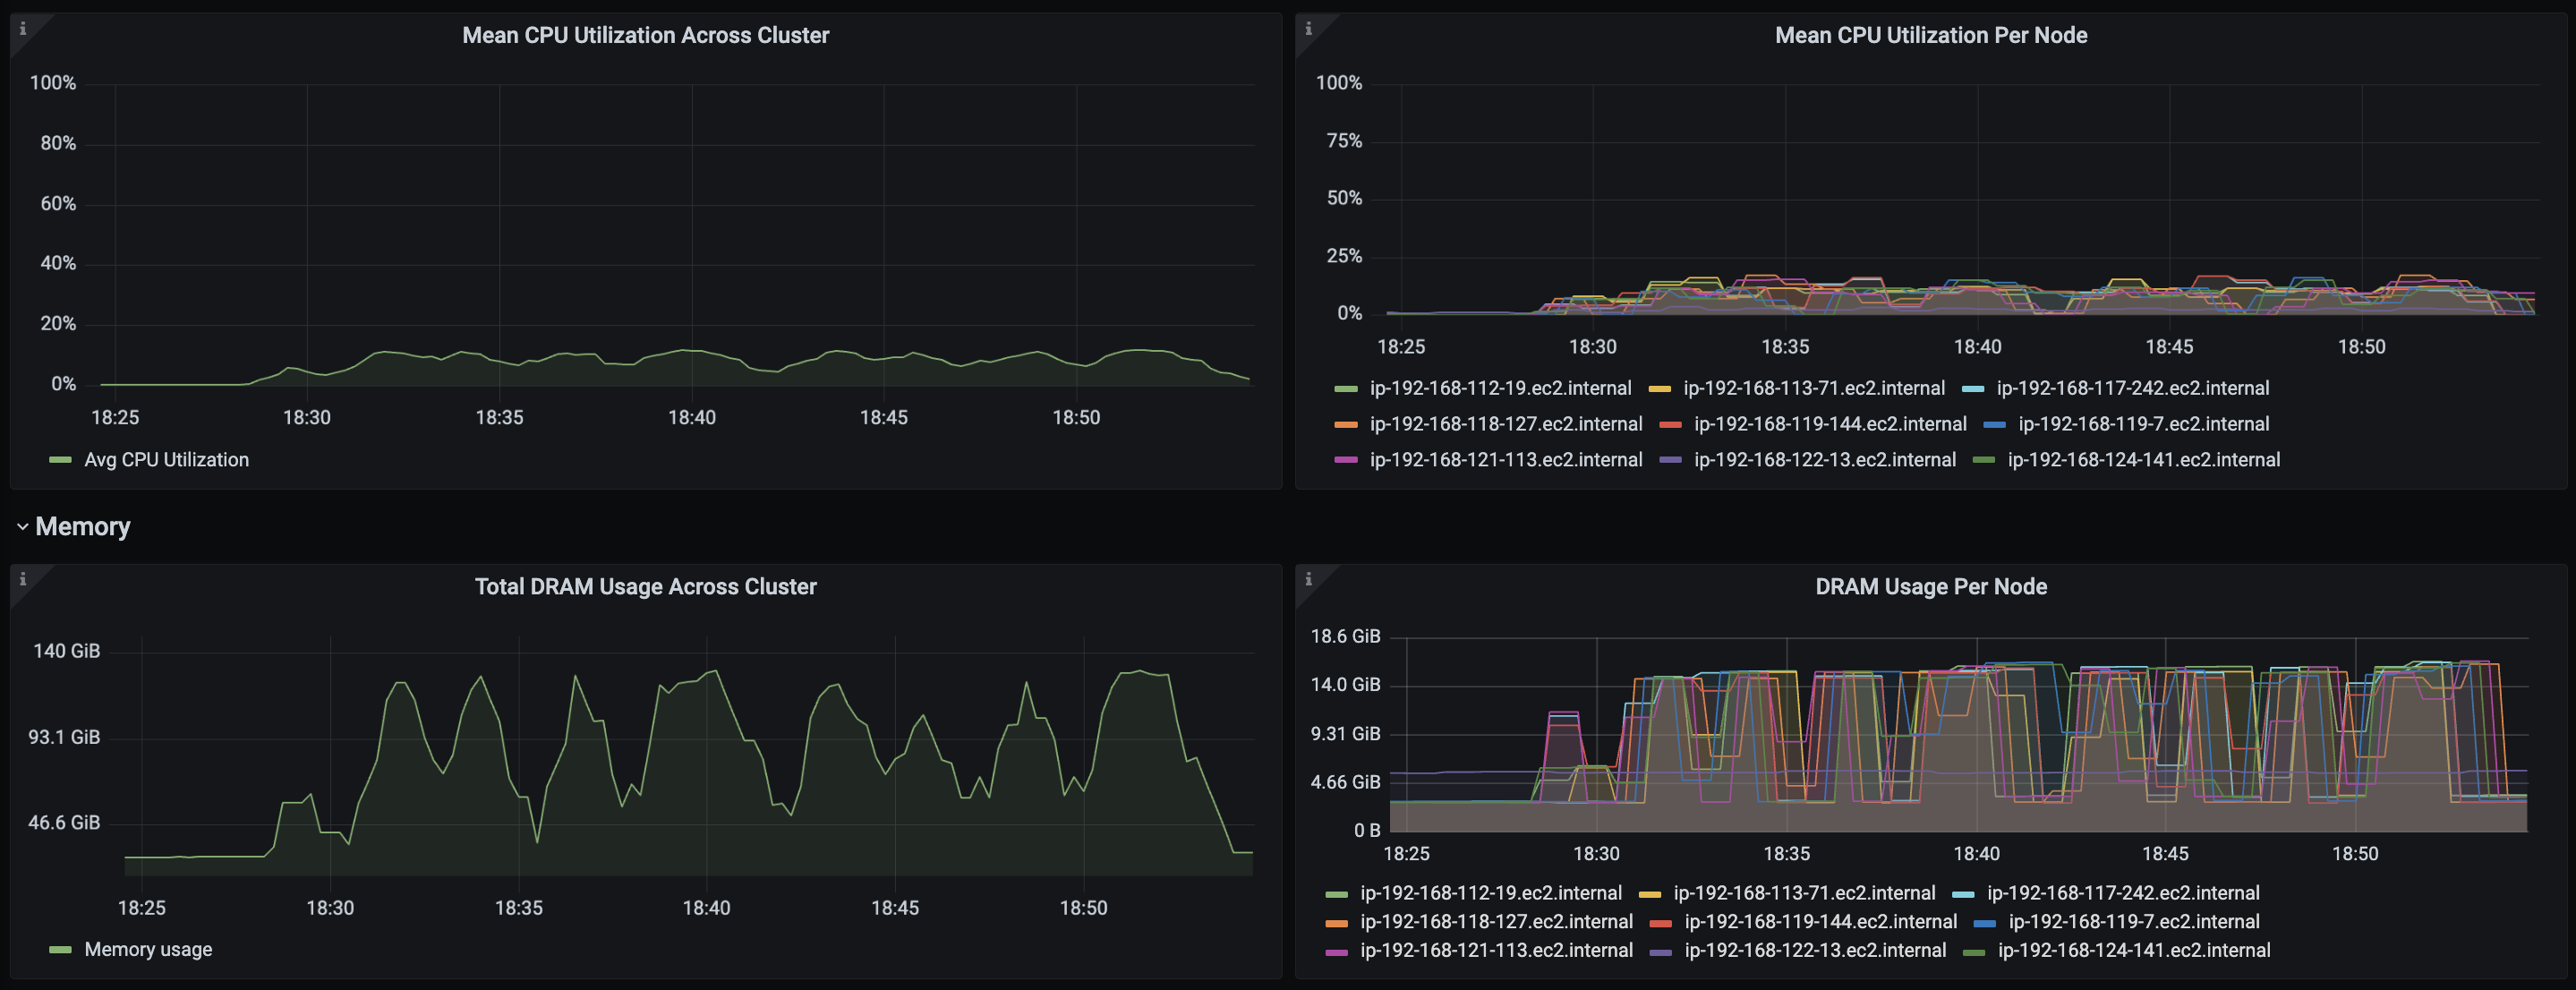
The plots depict the usual metrics AI developers want to see: GPU metrics (utilization, SM activity, VRAM usage), as well as DRAM, CPU, network, and disk metrics.
All metrics are depicted as window-adjustable time series. The right column shows them per machine in the cluster, averaged within each machine for multi-core CPUs and multiple GPUs. The left columns shows the global average for the cluster across all machines.


